At first glance, the Net Promoter Score formula might seem a little unusual. It’s not an average or a simple rating. Instead, it’s a powerful calculation that gives you a sharp, clear picture of customer loyalty by asking one simple question.
The core formula is % Promoters - % Detractors = NPS. To get there, you first have to sort every survey response into one of three buckets. Getting a handle on these groups is the key to understanding what your final score actually means.
The NPS Formula Calculator in 60 Seconds

The entire NPS system hinges on a single question: “On a scale of 0-10, how likely are you to recommend our company/product/service to a friend or colleague?”
But here’s the crucial part: you don't average these scores. Instead, you group the responses to understand the sentiment behind the numbers. This segmentation is what turns a simple survey into a predictive measure of customer loyalty and future growth. It's the secret sauce of the NPS system.
The Three Customer Groups
Before you can calculate anything, you need to know who you're dealing with. Every person who answers your survey falls into one of three distinct categories, and each one tells a very different story about their experience with your brand.
- Promoters (Score 9-10): These are your champions. They aren't just happy; they're genuine fans who actively tell others about you. Promoters are the engine of organic growth.
- Passives (Score 7-8): These customers are content, but that's about it. They got what they paid for, but they aren't emotionally invested in your brand. They’re easily swayed by a competitor’s better offer.
- Detractors (Score 0-6): These are your unhappy customers. At best, they're quietly disappointed. At worst, they're actively sharing their bad experiences, which can damage your reputation and scare off potential new customers.
The NPS formula deliberately ignores the middle-of-the-road Passives. It focuses on the two groups at the extremes—your biggest fans and your biggest critics—to give you an unfiltered look at your brand's health.
Once you have your responses sorted, the math is simple. Tally up the number of people in each group. Then, find the percentage of Promoters and the percentage of Detractors out of the total number of responses.
Finally, subtract the Detractor percentage from the Promoter percentage. The result is your Net Promoter Score, a single number that can range anywhere from -100 (everyone is a Detractor) to +100 (everyone is a Promoter).
Here is a quick breakdown to help visualize the process.
NPS Calculation At a Glance
This table maps out how each response fits into the final calculation, from the initial score to its role in the NPS formula.
| Score Range | Category | Description | Impact on Formula |
|---|---|---|---|
| 9–10 | Promoters | Your most loyal and enthusiastic customers; brand advocates. | Positively contributes to your score. |
| 7–8 | Passives | Satisfied but unenthusiastic customers; vulnerable to competitors. | Ignored in the final calculation. |
| 0–6 | Detractors | Unhappy customers who can damage your brand through negative word-of-mouth. | Negatively contributes to your score. |
Ultimately, this structure ensures your score reflects the balance between your most positive and most negative customer experiences.
How the NPS Formula Actually Works
Getting a handle on the Net Promoter Score starts with understanding the simple math behind it. The whole thing kicks off by asking that one famous question: “How likely are you to recommend us?” From there, you just need to sort the answers into three buckets.
This sorting step is where the magic really happens. We’re not just looking for an average rating here. Instead, we're trying to measure the tension between your biggest fans and your harshest critics. Each group gives you a completely different—and equally valuable—piece of the puzzle.
Sorting Responses Into Three Groups
Once your survey is out in the wild and the responses start rolling in, every single one will fit into one of these three categories based on the 0-10 score they gave you:
- Promoters (Scores 9-10): Think of these folks as your brand champions. They’re the loyal customers who are actively telling their friends and family about you, driving real, organic growth.
- Passives (Scores 7-8): These customers are content, but they aren't exactly singing your praises. They're satisfied enough for now, but they could easily be swayed by a competitor’s shiny new offer.
- Detractors (Scores 0-6): This is the group of unhappy campers. They’ve had a bad experience and aren’t afraid to share it, potentially damaging your reputation through bad reviews and negative word-of-mouth.
The NPS formula deliberately hones in on the two extremes—the Promoters and the Detractors. By setting the neutral middle group aside, it gives you a sharp, unfiltered signal of just how loyal your customer base really is.
People often ask, "Why are Passives ignored in the final calculation?" It's a great question. The formula is specifically designed to measure the tug-of-war between brand advocacy and brand damage. Since Passives don't really contribute to either side, they're left out to keep the score focused and actionable.
Calculating Your Final NPS
After you’ve sorted your responses, figuring out your score is a breeze. Let's run through a quick example. Say you just collected exactly 100 survey responses.
Count up each group:
- You have 70 Promoters (scores of 9 or 10).
- You have 20 Passives (scores of 7 or 8).
- You have 10 Detractors (scores of 0 to 6).
Figure out the percentages:
- Percentage of Promoters = (70 / 100) * 100 = 70%
- Percentage of Detractors = (10 / 100) * 100 = 10%
Plug them into the NPS formula:
- NPS = Percentage of Promoters - Percentage of Detractors
- NPS = 70% - 10% = 60
And there you have it. Your final Net Promoter Score is 60. It's important to remember that this isn't a percentage. It’s a solid number on a scale from -100 to +100. In 2026, what matters most isn't a single snapshot but tracking this score over time to see how you're improving.
If you're looking to get a wider view of customer happiness, you might also want to learn how to calculate CSAT score to add another tool to your belt.
What a Good NPS Score Really Means
So, you've plugged your numbers into the NPS formula and you've got a score. Now what? The first instinct is to ask, "Is this a good score?" But the real answer isn't a simple yes or no. The truth is, a score that’s phenomenal for one industry might be mediocre in another.
Think of it like getting a test score back. A 75% in advanced calculus feels a lot different than a 75% in an introductory course. The same logic applies here. A score of +30 would be a huge win for a telecom company, an industry that often struggles with customer satisfaction. But for a beloved online retailer where expectations are sky-high, that same +30 could be a red flag.
This is why context is king. Your NPS score isn't just a number to hang on the wall; it’s a living, breathing indicator of how you stack up against the competition and the strength of your customer relationships.
Putting Your Score in Context
To make any sense of your score, you have to benchmark it. The most important place to start is by looking at the difference between Business-to-Business (B2B) and Business-to-Consumer (B2C) companies. Their customer bases are entirely different, which naturally leads to different NPS ranges.
- B2B Companies: These businesses typically manage fewer, but much larger, client relationships. Their NPS is often driven by things like the quality of their account management, the reliability of their service, and the ROI they deliver.
- B2C Companies: B2C brands serve a huge volume of individual customers. For them, things like frontline customer service, brand image, and the immediate user experience are what move the needle.
By 2026, the smartest companies will be using their NPS results alongside deep, industry-specific benchmarks. We know from current data that average NPS scores in B2B sectors usually land somewhere between the high 30s and high 60s. B2C is a much wider spectrum, with scores ranging from the mid-teens all the way up to 80. For example, the insurance industry can see averages near 80, while consulting services often sit in the high 60s.
Benchmarking Beyond the Basics
While B2B vs. B2C is a good starting point, the real magic happens when you drill down even further. Are you in SaaS, retail, or healthcare? Every industry has its own rhythm and its own set of customer expectations. Finding benchmarks for your specific niche will give you the clearest picture.
This is a great visual breakdown of how the three groups—Detractors, Passives, and Promoters—come together to create your final score.
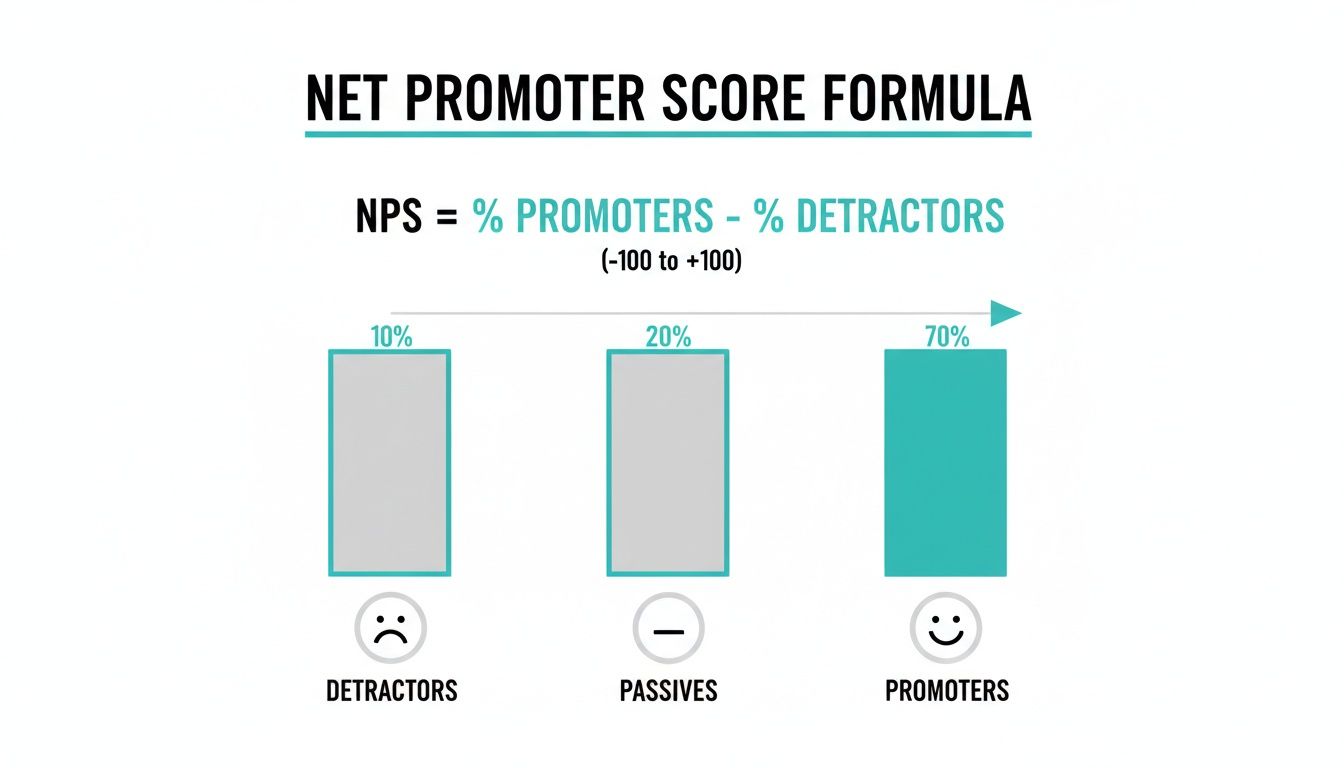
As you can see, the final number is all about the balance between your biggest fans and your unhappiest customers.
A "good" score is one that is consistently improving over time and compares favorably against your direct competitors. Don't chase a vanity number; focus on the trend. An upward trajectory from +10 to +20 is more meaningful than a stagnant score of +40.
At the end of the day, NPS is just one tool in your toolkit. It's a fantastic gauge of loyalty, but it's wise to see how it fits in with other customer satisfaction measurement methods for a complete picture. The real value isn't in the number itself, but in the actions you take based on what it's telling you.
Common Mistakes That Invalidate NPS Results

The NPS formula is beautifully simple, but that’s also what makes it so easy to get wrong. A few common missteps can easily skew your data, leading you to make bad decisions based on a number that doesn't reflect reality.
One of the biggest traps is obsessing over the score itself. Chasing a high number feels good, but the real gold is in the trend. Is your score climbing, even slowly? That tells a much more powerful story about your improvements than a high-but-stagnant score.
Another classic error is forgetting to ask the all-important follow-up question: "Why did you give that score?" The number tells you what people feel, but the open-ended feedback tells you why. Without that context, your NPS score is just a number floating in space—and you can't build a strategy on that.
Surveying the Wrong Audience at the Wrong Time
When it comes to NPS, timing and targeting are everything. If you send a survey too early in the customer journey or to someone who hasn't interacted with you in months, the feedback you get will be fuzzy at best. Your data is only as good as the audience you're asking.
For sharp, actionable insights, you need to survey customers right after key moments when the experience is still fresh in their minds. Think about triggering surveys after events like:
- A recent purchase is delivered
- A customer support ticket is resolved
- The onboarding process is complete
The idea is to connect the feedback directly to an experience. Asking about a purchase made six months ago won't give you nearly the same quality of insight as asking the day after the product arrives.
Forgetting to Close the Loop
This is probably the most damaging mistake you can make: collecting feedback and then letting it gather digital dust. When a customer—especially a Detractor—takes the time to tell you what went wrong, they expect to be heard. Radio silence just confirms their negative opinion and practically guarantees they'll churn.
"Closing the loop" simply means following up with people who respond. Thank your Promoters for their kind words. More importantly, reach out to your Detractors to understand and address their specific issues. This one simple act can turn an angry critic into a loyal fan, just by showing you're listening. It proves you’re committed to getting better and that you value their time.
Many teams find it tough to get honest feedback, particularly when it's negative. To learn how to create a space for candid responses, check out our guide on using an anonymous feedback form to encourage more truthful insights.
Improve Your Data Collection with Conversational Forms

Let's be honest: the accuracy of your NPS score lives and dies by the quality of the data you gather. If you're dealing with low response rates or survey fatigue, your results will be skewed, painting a picture of customer sentiment that isn't quite right. In 2026, the secret isn't just about asking the right question—it’s about asking it in the right way.
Traditional, static forms often feel cold and impersonal, which is a surefire way to make people abandon them. This is exactly where conversational forms come in. By framing questions in a friendly, chat-like interface, the whole experience feels less like a chore and more like a real conversation.
This is a game-changer on mobile devices, where everyone is already comfortable with messaging. The payoff is a more engaging survey that actually encourages customers to give you their honest feedback.
Why Do Conversational Surveys Perform Better?
That old grid of questions on a long, scrolling page is starting to feel ancient. A conversational approach guides the user through one question at a time, which dramatically reduces their mental effort. It feels faster, more intuitive, and just... easier. You're meeting customers on their terms.
Formbot, a no-code form and survey builder, is built around this very idea: turning data collection into a two-way dialogue. You can create your survey using a modern chat-style format or a guided, one-question-at-a-time flow. This simple switch can help increase completion rates and gather higher-quality submissions, especially on mobile where chat interfaces feel right at home.
Ultimately, you need to capture two things: the quantitative "what" (the 0-10 score) and the qualitative "why" (the open-ended feedback). A conversational flow makes getting both so much simpler.
Building an NPS Survey That Actually Works
The good news is that creating a survey that gets you rich data isn't complicated. The trick is to use smart logic that reacts to how the user responds. With a tool like Formbot, you can set this up in minutes without touching a single line of code.
Here’s a simple, powerful structure to follow:
- Ask the Core NPS Question: Kick things off with the standard, "On a scale of 0-10, how likely are you to recommend us?" This gives you the number you need for your NPS formula.
- Use Conditional Logic: This is where the magic happens. Based on the score, you'll ask a specific follow-up question. If someone gives you a Detractor score (0-6), your form can automatically ask, "We're sorry to hear that. What could we do to improve your experience?"
- Capture the "Why": For your biggest fans, the Promoters (9-10), you could ask something like, "That's great to hear! What did you like most about your experience?" This feedback is pure gold—it tells you exactly what you're doing right.
This simple two-step process ensures you’re not just calculating a score, but truly understanding the reasons behind it. For more tips on building better surveys, check out our full guide on 10 form design best practices.
Turn Your NPS Insights into Action
Getting your Net Promoter Score is just the first step. The real work—and the real value—begins after you have that number. Think of your score not as a static report card, but as a living roadmap for growth. It shows you exactly what’s working and, more importantly, what isn’t.
The key is to stop looking at your audience as one giant monolith. Instead, you need to break down the feedback and create a tailored plan for each of the three NPS groups: Promoters, Passives, and Detractors. Each one requires a completely different approach.
Closing the Loop with Detractors
Your Detractors (those who scored you from 0-6) need your immediate attention. These are the folks who had a bad experience, are at risk of leaving, and might even tell others to stay away.
The most powerful thing you can do is "close the loop" and reach out to them personally. This isn't the time to get defensive. Your only job is to listen, understand their specific problem, and show them you're taking it seriously. You'd be surprised how often a genuine apology and a clear plan to fix things can turn an unhappy customer into a loyal one.
Engaging Your Passives and Promoters
Next up are your Passives (scores 7-8). These customers are your biggest untapped opportunity. They’re content, but not thrilled, which makes them prime targets for your competitors. The goal here is to figure out what’s keeping them on the fence.
A simple follow-up question like, "What’s one thing we could have done to make your experience a 10?" can reveal incredibly useful feedback for improving your product or service. For more ideas, check out our guide on how to improve your NPS score.
Finally, don't forget your biggest fans—the Promoters (scores 9-10). These are the people who are ready to shout about your brand from the rooftops. You just have to ask. Mobilize their enthusiasm by inviting them to:
- Leave testimonials and reviews on sites that matter.
- Participate in case studies that tell their success story.
- Refer friends and colleagues to your business.
The Net Promoter Score formula is built on a deceptively simple equation, but it unlocks a global measurement system. SurveyMonkey’s 2026 benchmark, based on data from over 150,000 organizations, shows a global average NPS of +32. This context is crucial for understanding where you stand and what a meaningful improvement looks like.
A Few Final Questions About NPS Calculation
As we wrap up, let's tackle some of the most common questions that pop up when you start calculating your Net Promoter Score. Getting the details right is the key to making sure your final number is actually useful.
Wait, Why Don't Passives Count in the Formula?
It seems a little strange at first, right? You're just ignoring a whole group of people. But the NPS formula is specifically designed to measure the most intense feelings your customers have—it's a tug-of-war between your biggest fans and your loudest critics.
Passives sit on the sidelines. They aren't actively cheering for you or booing you. Including their neutral scores would just water down the result and hide the real tension between your Promoters and Detractors. That said, you should absolutely keep an eye on that Passive percentage. They're the customers most likely to be poached by a competitor with a slightly better offer.
Is It Possible to Get a Negative NPS Score?
Definitely. And while it stings, it's incredibly valuable information.
Since the final score is a simple subtraction (% Promoters - % Detractors), you’ll end up with a negative number anytime you have more critics than fans. A score can be anything from -100 (everyone is a Detractor) to +100 (everyone is a Promoter). A negative score is a serious red flag that your customer experience has some major problems that need immediate attention.
How Often Should I Be Measuring NPS?
There's no single right answer here—it really depends on your business.
A quarterly survey is a great starting point and a common best practice. This gives you a regular pulse check without overwhelming your customers. It also gives your team enough time to actually act on the feedback before you measure again.
For a more detailed view, you can also use "transactional" NPS surveys. These are triggered by specific events, like right after a customer makes a purchase or finishes a chat with your support team. This helps you pinpoint exactly which parts of the customer journey are creating fans and which are causing frustration.
Ready to collect NPS feedback that actually drives growth? Formbot lets you build engaging, conversational surveys in seconds with its no-code builder. See how easy it is to capture both the score and the story behind it. Start building smarter forms today at https://tryformbot.com.